2009 April 06 Central Italy Earthquake
April 07, 2009
April 08, 2009
Strong Motion Seismology Group
A Mw 6.2 earthquake occurred in the central Italy at 01:32:39 UTC on April 06, 2009.
According to the
USGS preliminary report, the earthquake epicenter is located close to L'Aquila
in the central Appenine mountains.
The earthquake was generated by the normal faulting along the active
Celano-L'Aquila fault system, which extends NW-SE being parallel to
the axis of the Appennine mountains.
The initial location of the hypocenter according to the
USGS and
INGV, Italy
is lat = 42.334 N, lon = 13.334 E, and depth = 10 km.
To investigate the source process of this earthquake, we have
performed the teleseismic waveform inversion of Kikuchi and Kanamori
(1991) using displacement records observed at FDSN stations from IRIS
DMC. The 34 vertical components of the P-wave data at epicentral
distances of 30 - 100 deg were used in the inversion (Fig. 1).
According to the aftershock distribution (Fig. 2) and the previous
studies of the active fault system in Celano-L'Aquila (e.g., Salvi et
al., 2003), we assumed that the fault plane is dipping to the
southwest with a dimension of 25 km in length by 15 km in width.
We also assumed strike = 147 deg and dip = 44 deg, based on the
residuals of the point source analysis and the aftershock
distribution. We fixed the epicenter to the location determined by
USGS and searched for a focal depth that maximizes the waveform fit.
The optimal depth is 6 km as shown in Fig. 3.
In the obtained slip distribution over the fault plane, we can find a
single large asperity. The peak slip of about 0.5 m appears on the
shallow part of the fault plane.
The slip distribution also suggests that the rupture propagated
towards the southeast.
The results of the inversion are summarized in Fig. 3.
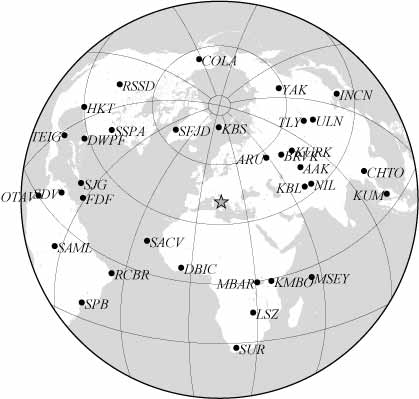
Fig. 1. Stations used for the teleseismic waveform inversion.
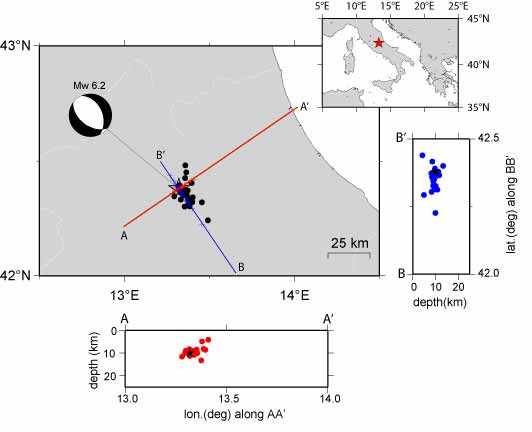
Fig. 2. Distribution of aftershocks (black dots) and cross
sections along the lines A-A' (red dots) and B-B'(blue dots).
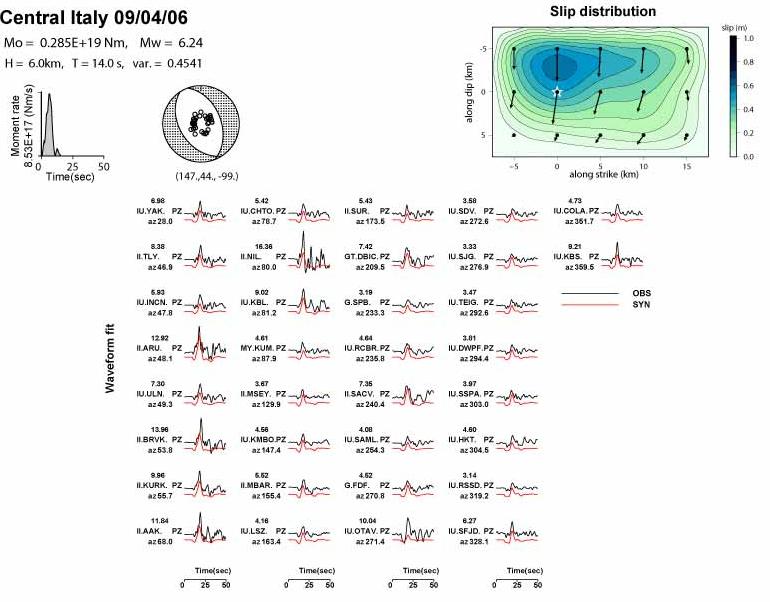
Fig. 3. Source time function, point source solution, slip
distribution, and comparison of the obsereved and synthetic
displacement waveforms.
Link
2010 Feb 27 Central Chile Earthquake
2010 Jan 12 Haiti Earthquake
2009 Aug 09 South Off Tokaido, Japan, Earthquake
2009 July 15 Fiordland, New Zealand Earthquake
2009 Apr 06 Central Italy (L'Aquila) Earthquake
2009 Mar 19 Tonga Region Earthquake
2009 Jan 03 Irian Jaya, Indonesia, Earthquakes
2008 Nov 16 Sulawesi, Indonesia, Earthquake