2009 July 15 Fiordland, New Zealand, Earthquake
July 17, 2009
Strong Motion Seismology Group
An earthquake of Mw 7.8 (Global CMT Project)
occurred near the west coast of the South Island of New Zealand
(region known as Fiordland) at 09:22:29 UTC on July 15, 2009.
According to the
USGS preliminary report,
the earthquake epicenter is located at the boundary between the Australian and
Pacific plates in a complex region defined by the transition from an oblique
subduction of Australian plate beneath the Pacific plate in the south
(along the Puysegur Trench) to the strike-slip motion further north along
the South Island (Alpine fault).
The
USGS reported that the event was generated by a thrust mechanism on the subduction
interface between the Pacific and Australian plate. The preliminary location of the hypocenter
is lat = 45.750 S, lon = 166.577 E, and depth = 12 km.
To investigate the source process of this earthquake, we have
performed the teleseismic waveform inversion of Kikuchi and Kanamori
(1991) using displacement records observed at FDSN stations from IRIS
DMC. The 42 vertical components of the P-wave data at epicentral
distances of 35-100 deg. were used in the inversion (Fig. 1).
We fixed the epicenter determined by USGS and search for the focal depth
to minimize the waveform fit. The residuals of both the point source and the
finite fault inversion prefer a low-angle east-dipping fault plane (strike = 27 deg., dip = 32 deg.)
This is also supported by the aftershock distribution (Fig. 2). The focal depth was estimated to be 30 km.
In the obtained slip distribution over the fault plane, we can find a
single large asperity. The peak slip of 4.8 m appears on the
shallow part of the fault plane, at the depth of 10-15 km.
The results of the inversion are summarized in Fig. 3.
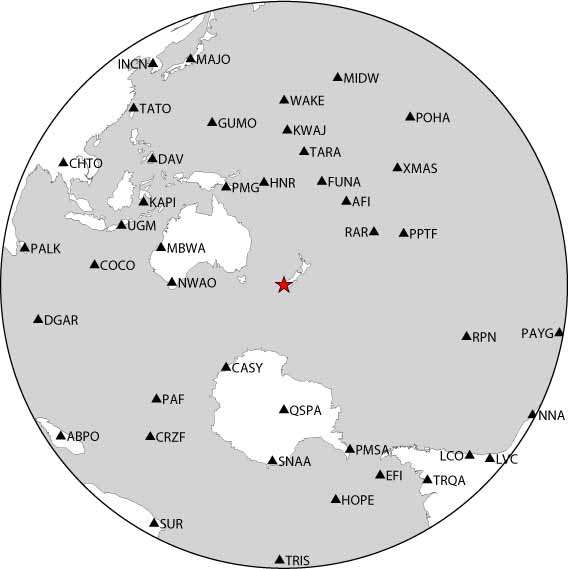
Fig. 1. Stations used for the teleseismic waveform inversion.
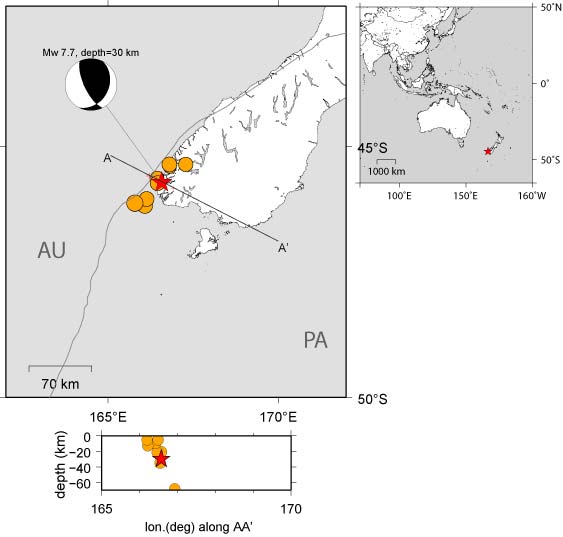
Fig. 2. Distribution of aftershocks (black dots) and cross
sections along the lines A-A' (red dots).
The location of the July 15, 2009 New Zealand earthquake (red star).
Orange circles correspond to the aftershocks reported by USGS.
Heavy gray line correspond to the plate boundaries of
the Australian (AU) and Pacific (PA) plates after Bird (2003).
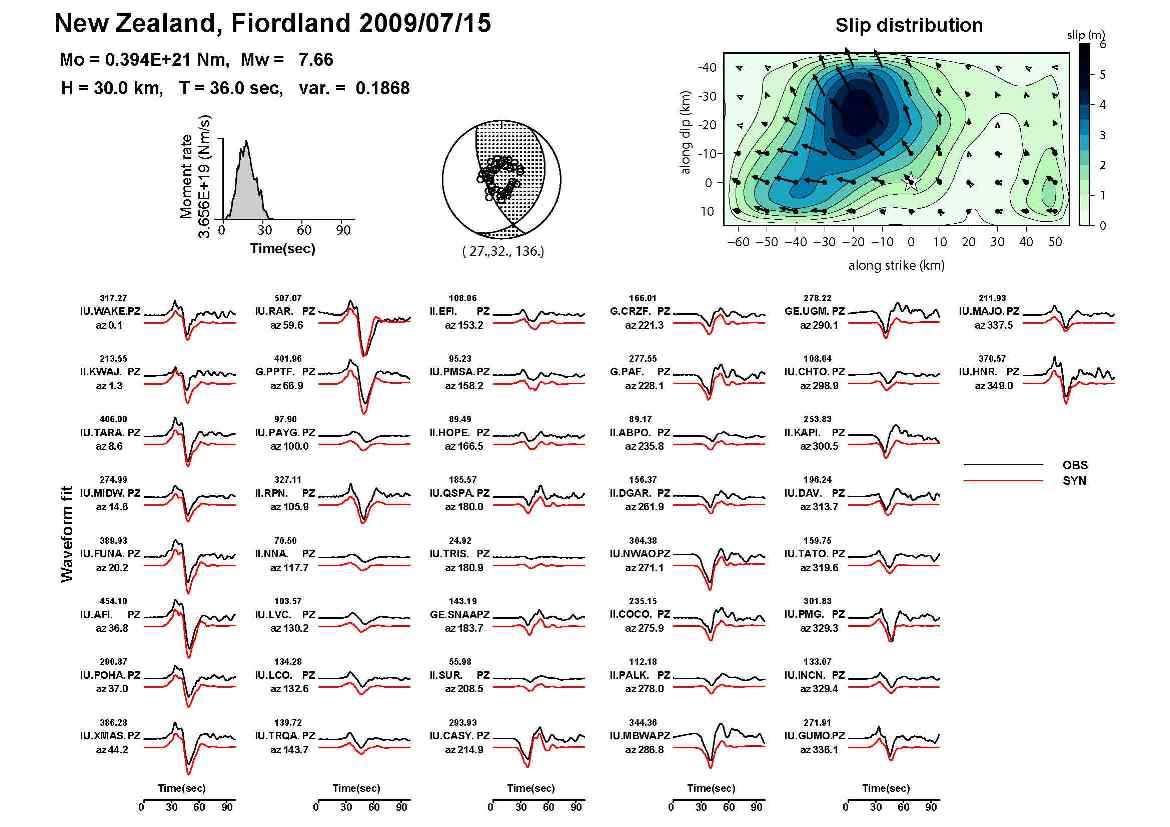
Fig. 3. Source time function, point source solution, slip
distribution, and comparison of the obsereved and synthetic
displacement waveforms.
Link
2010 Feb 27 Central Chile Earthquake
2010 Jan 12 Haiti Earthquake
2009 Aug 09 South Off Tokaido, Japan, Earthquake
2009 July 15 Fiordland, New Zealand Earthquake
2009 Apr 06 Central Italy (L'Aquila) Earthquake
2009 Mar 19 Tonga Region Earthquake
2009 Jan 03 Irian Jaya, Indonesia, Earthquakes
2008 Nov 16 Sulawesi, Indonesia, Earthquake