- Ground motion synthesis by the reflectivity method (1984∼1985)
- Eterm and "MS-DOS" (1986∼1989)
- Ray tracing by the pseudo-bending method (1991∼1998)
- Table of major damaging earthquakes in Japan (2001∼)
- Japan Integrated Velocity Structure Model (2008∼)
- Velocity structures in and around Kathmandu Valley (2020∼2024)
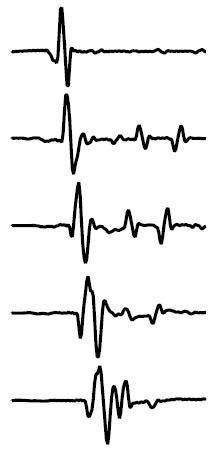
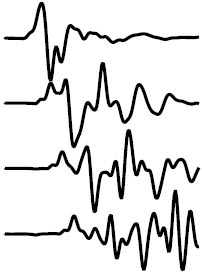
A Fortran code has been developed for calculating the complete ground motion due to a point source in a horizontally layered structure (one-dimensional structure) based on the reflectivity method. (Kohketsu, 1985, J. Phys. Earth, 33, 121-131, Fig. 1). The package including the code and sample input data has been published on ftp.eri.u-tokyo.ac.jp for a long time, and it is also available below. The paper covers what is necessary and sufficient, but a more detailed explanation of the theory and formulation can be found in Sections 2.2 and 3.1 of "Ground Motion Seismology". In addition, as a demonstration, the code is compiled in Cygwin (Linux environment on Windows) and a package of the results of calculating ground motions with two sample data is also available (the resultant waveforms are shown below).
|
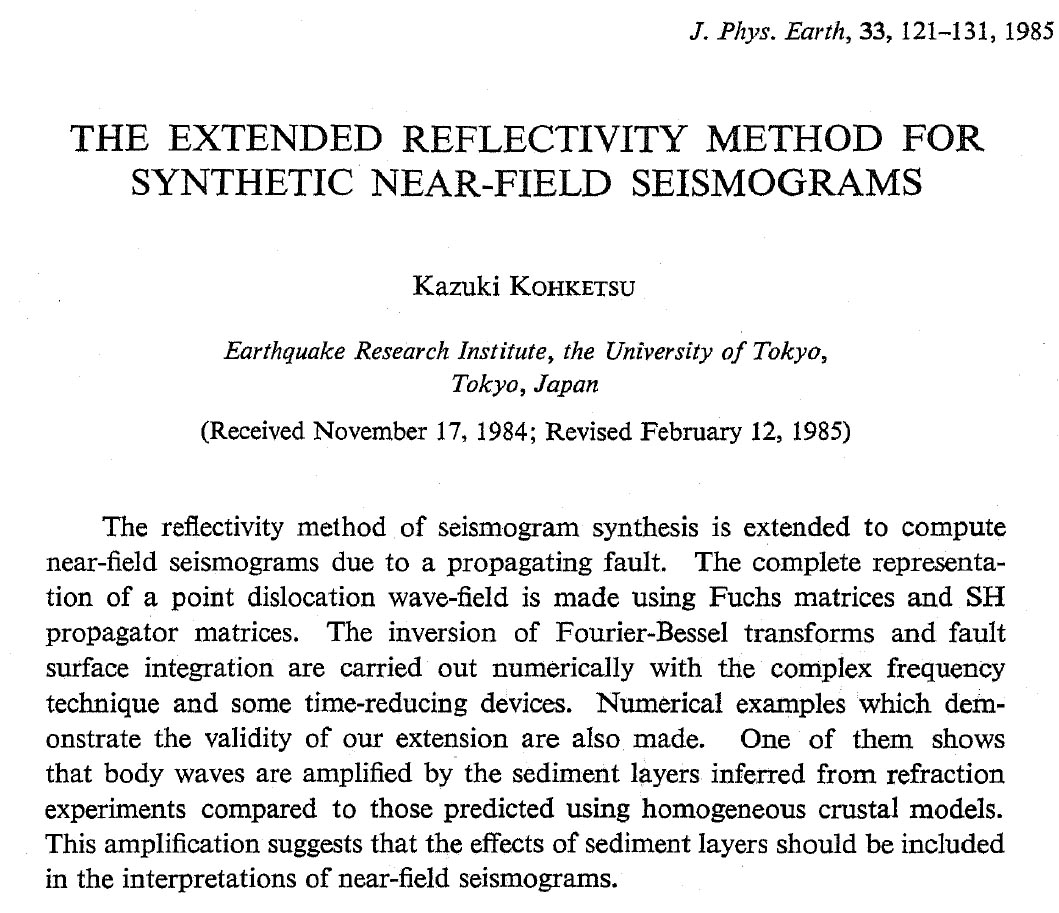
Figure 1. Beginning of Journal of Physics of the Earth paper by Kohketsu (1985). |
|
As I wrote in the contribution in Fig. 2, in addition to the work and research
assigned during my assistant professorship, I was also doing things like making
use of PCs, which were in their infancy, because the work was strongly related
to computers and I have the innate "Otaku" personality.
Among them, we developed the software called Eterm for communication between a PC
and the TSS of a mainframe computer.
As announced in the University of Tokyo Computer Center News, Eterm gained a large
number of users, and several derivative versions were made for the computer centers
of other universities. Therefore, it was highly evaluated at the computer center directors' meeting and we received the 1990 Program Creation Award. However, communication and screen input/output strongly depend on the hardware of NEC's PC-9800 series, which was the mainstream at that time, so that Eterm does not work with the Windows command prompt on a current PC. However, it seems to be of historical value, and I have put some versions of its source code below. Based on the knowledge and experience gained in the development of Eterm, from the perspective of explaining the structure of MS-DOS, which was the OS of a PC at that time, and its interfaces with a program, we wrote "MS-DOS", Volume 4 of the OS series by Kyoritsu Shupan. Although it was first published in 1988, used copies are still available on the Amazon site, and we have received a customer review called "The monument to the handbook on MS-DOS." The source codes of the sample programs in it are also placed below. |
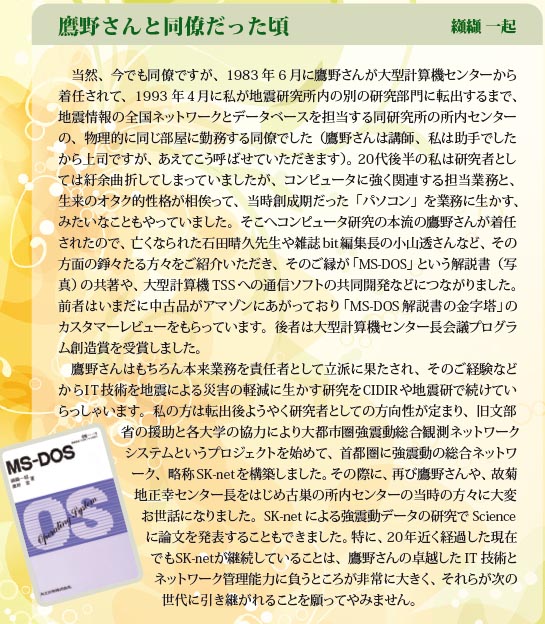
Figure 2. Contribution to "For the Retirement of Professor Takano" in No. 39 |
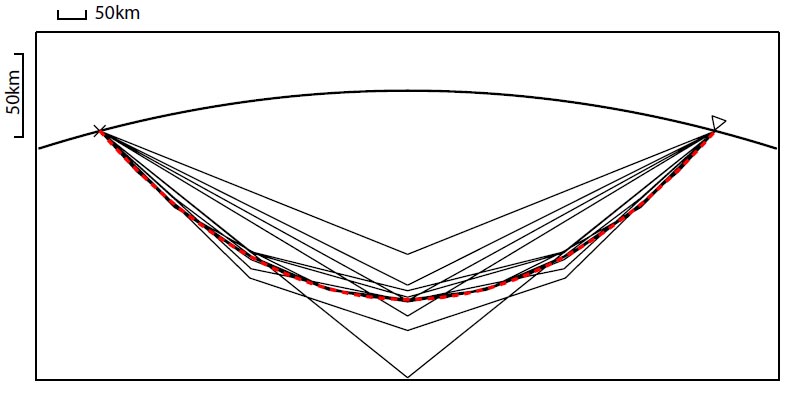
We developed Fortran codes
for seismic wave raytracing in the Earth's spherical coordinate system based on the pseudo-bending method (Koketsu and Sekine, 1998, Geophys. J. Int., 132, 339-346, Fig. 3). Below are packages that perform ray tracing in continuous structures and structures with discontinuities. They include the results of compiling and running the codes on Cygwin (Linux environment on Windows). The rays in the former are shown below. Although the paper contains sufficient information, a more detailed explanation of the theory and formulation can be found in Sections 3.2.2 and 3.2.3 of Ground Motion Seismology.
|
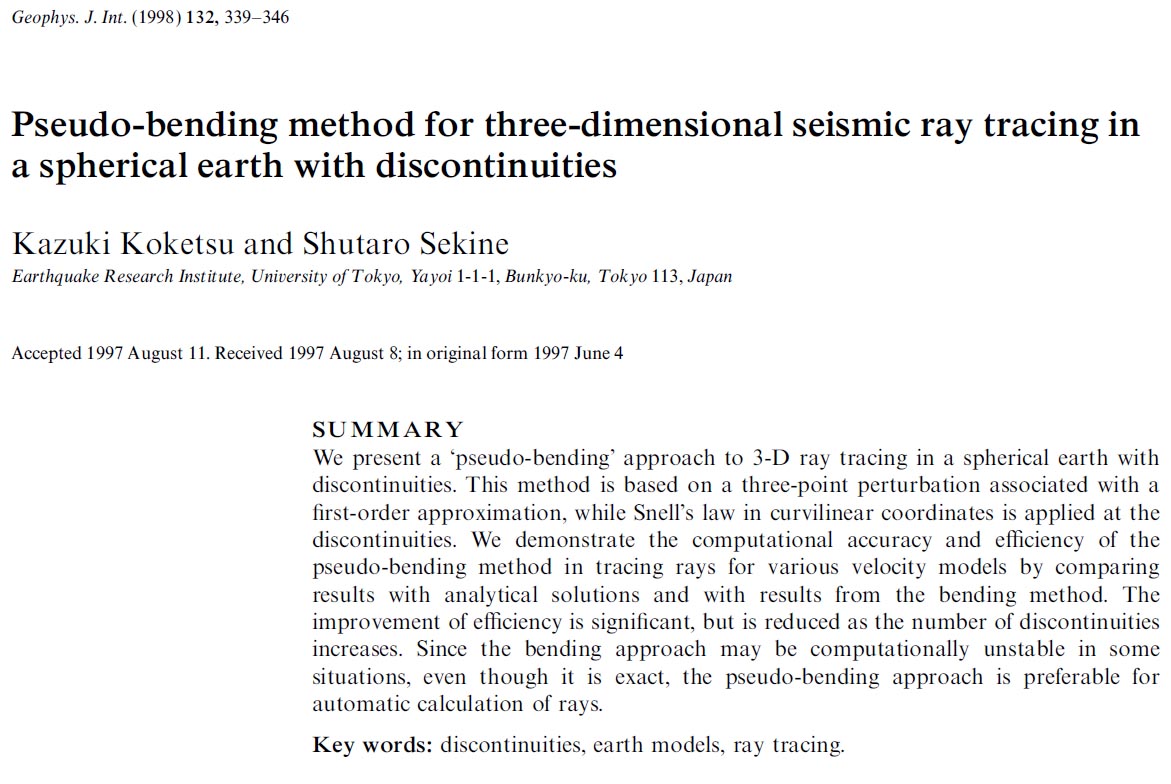
Figure 3. Front matters of the Geophysical Journal International paper by Koketsu and Sekine (1998). |
The description of the table is as follows.
We select the major damaging earthquakes in recorded history. The date, epicenter, magnitude (symbol “M”) corresponding to MJ, and area are based on “Materials for Comprehensive List of Destructive Earthquakes in Japan” (Usami et al., 2013 edition) and “Seismicity Studies: A Comprehensive Review” (Utsu, 1999) for earthquakes up to 1884, or “Table of Major Earthquakes in Japan” (Kayano and Utsu, 2001) in “Encyclopedia of Earthquakes 2nd edition” for earthquakes in 1885 to 1918. Other research results are also incorporated for both. Those for earthquakes in 1919 or later are based on monthly reports of Japan Meteorological Agency (JMA). As for the date, the Western calendar date (always the Gregorian calendar date) is shown first, followed by the Japanese calendar date in ( ).
The area is the disaster area by 1884, and the epicentral area from 1885 (the one currently used by JMA for earthquake information from 1919). However, * indicates the epicentral area used at that time. Numbers such as 3 are the damage grades by Utsu. The damage summary is based on the older editions of this table, “Materials for Comprehensive List of Destructive Earthquakes in Japan”, “Seismicity Studies: A Comprehensive Review”, “Table of Major Earthquakes in Japan”, disaster information of the Fire and Disaster Management Agency, and others.The seismic intensities from 1996 are instrumental intensities. Related deaths are not included in the death toll and are listed in parentheses. Totally (completely) or partially destroyed houses are counted by the number. Dates appearing in summaries by 1872 correspond to the Japanese calendar. The number in [ ] at the end of the summary is the scale of tsunami by Imamura and Iida. In principle, damage information is finalized after 5 years have passed.
Starting with the 2005 edition, we have been applying retroactively to 1885 the following selection criteria for earthquakes: the earthquake is selected in principle if 1 or more deaths, 1 or more houses totally (completely) destroyed, or 1 or larger tsunami scale was found for it. In addition, from the 2011 edition, the moment magnitude by the Global CMT Project is shown together with the symbol Mw, though * indicates a value from NIED or other literature. The symbol Ms in the term of teletsunami indicates the surface wave magnitude of an earthquake at the origin. For the damage grades, tsunami scale, and various magnitudes, please refer to “Earthquake-related Formulas and Tables”. The name is mainly based on “Seismology 3rd edition” (Utsu, 2001), but when an incorrect era name is included, it is added to the Japanese calendar with < >. From 1960, it is the name given by JMA, excluding the year.
The HTML version of the table in Japanese is divided into five, and they are located at the links below. The upper and lower links are for the parts of historical and modern earthquakes, respectively.
|
|
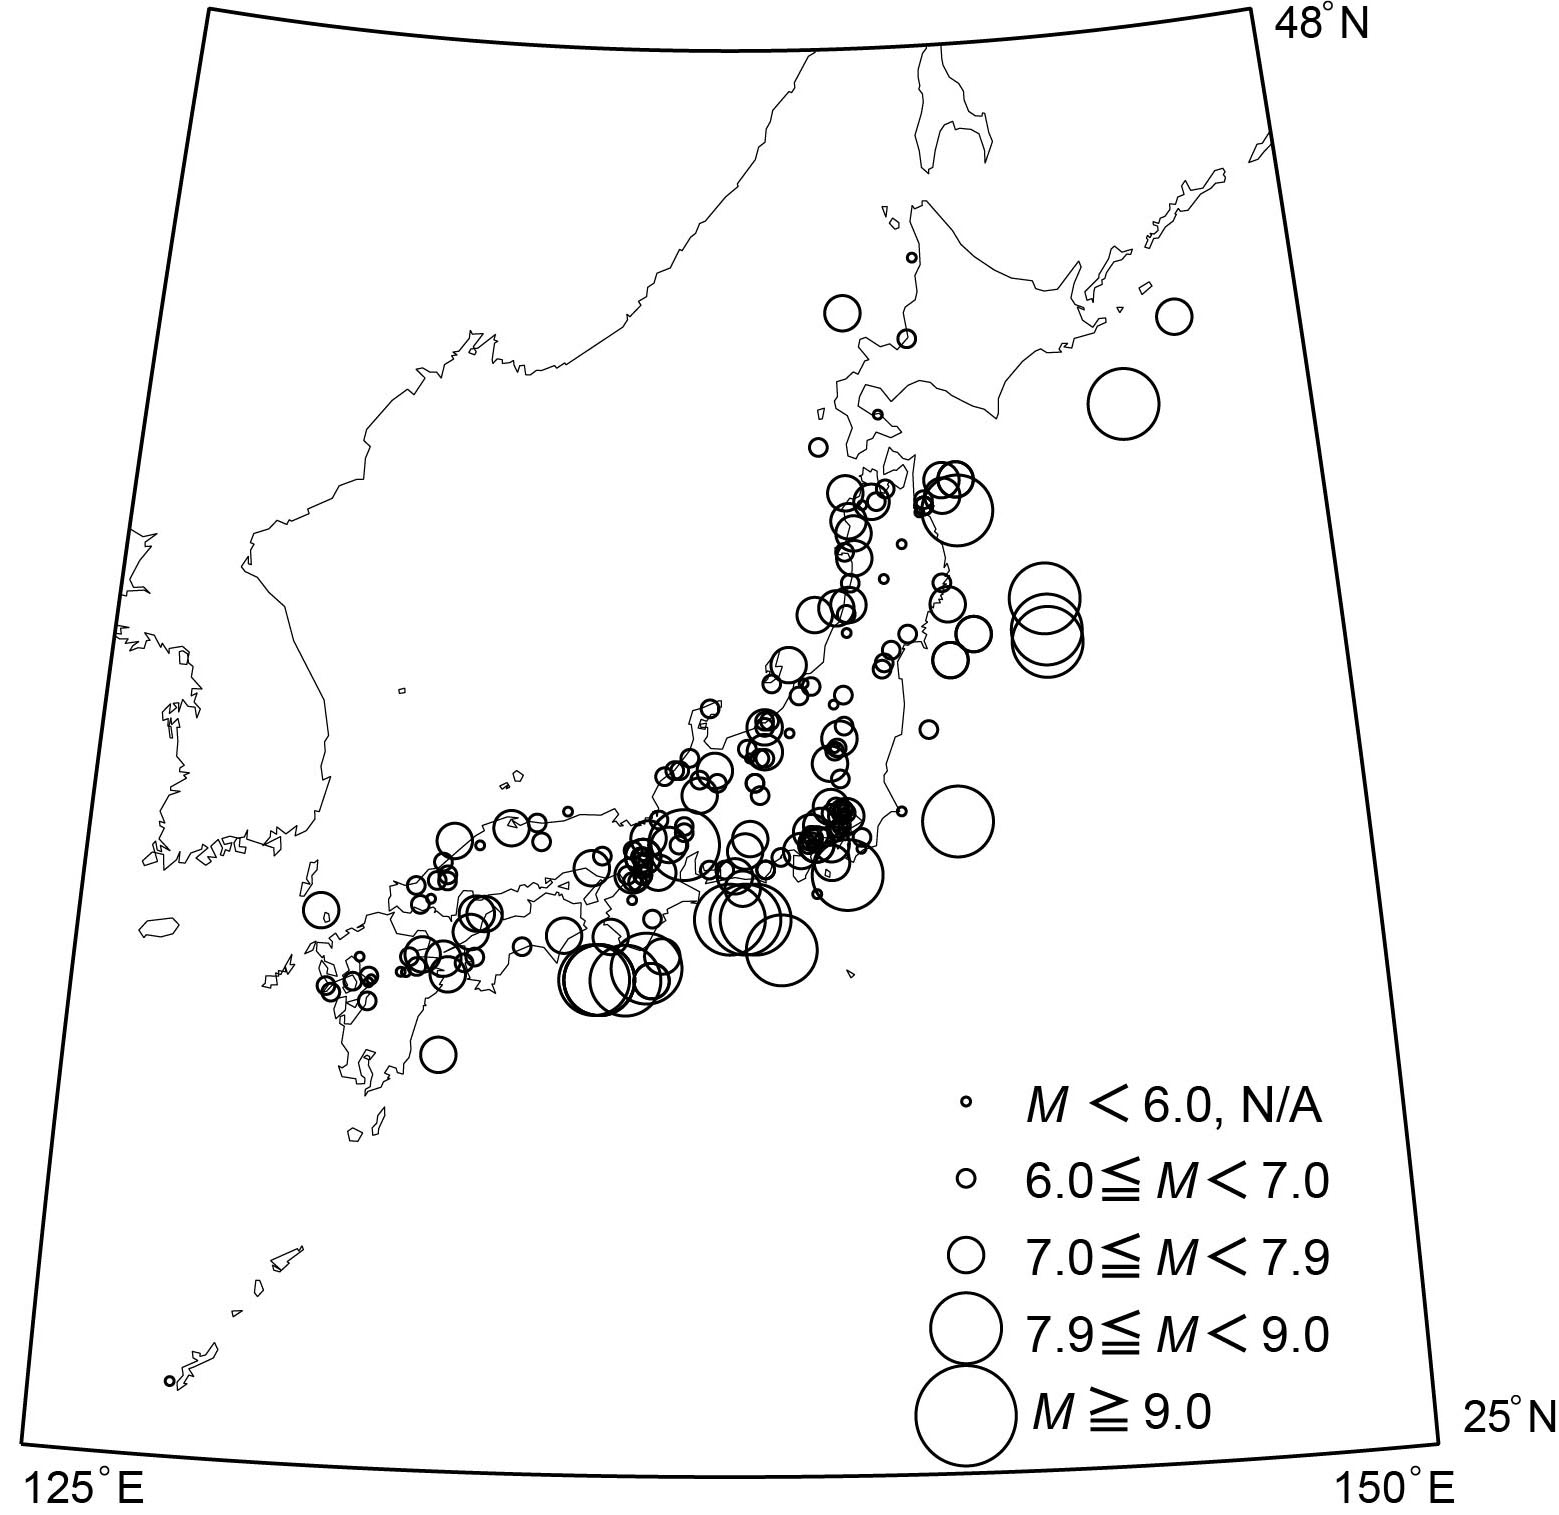
Fig. 4. Epicenters of major damaging earthquakes in Japan (by 1884). Earthquakes with undetermined latitude and longitude are excluded. If M is not available, the shape size is the same as if M is less than 6.0. |
|
|
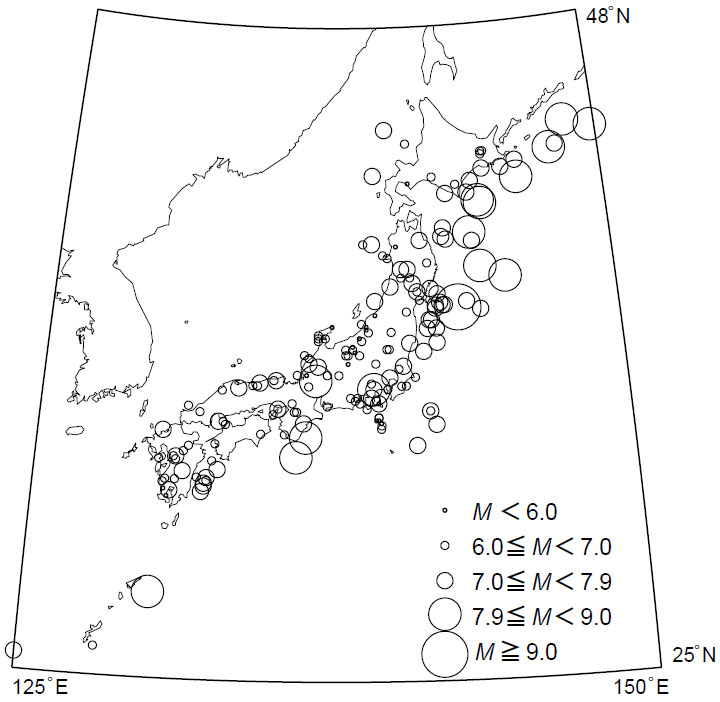
Fig. 5. Epicenters of major damaging earthquakes in Japan (from 1885). |
(Compiled by K. Koketsu, SFC Research Institute, Keio University)
The Japan islands are in a complex tectonic setting with various subducting plates, and most of their urban areas are located on sedimentary basins. These lead to three-dimensionally complicated velocity structures, which cause significant effects on the propagation of seismic waves from an earthquake to the urban areas. Accordingly, it is important for the simulation of long-period ground motion and its seismic hazard assessment to determine the three-dimensional (3-D) velocity structure of the whole Japan islands. We have already proposed a standard procedure for modeling a regional 3-D velocity structure in Japan, simultaneously and sequentially using various kinds of datasets such as extensive refraction/reflection experiments, gravity surveys, surface geology, borehole logging data, microtremor surveys, and earthquake ground motion records (Koketsu et al., 2009). We then applied this procedure to northeastern and central Japan in 2009, and to southwestern Japan in 2011. We further constructed the old edition of the Japan Integrated Velocity Structure Model Version 1 by combining these regional models in 2012. The body of this old edition is available on the website of the Headquarters for Earthquake Research Promotion, and a package of information on how to use it, including a link to that website, is located in the first place below.
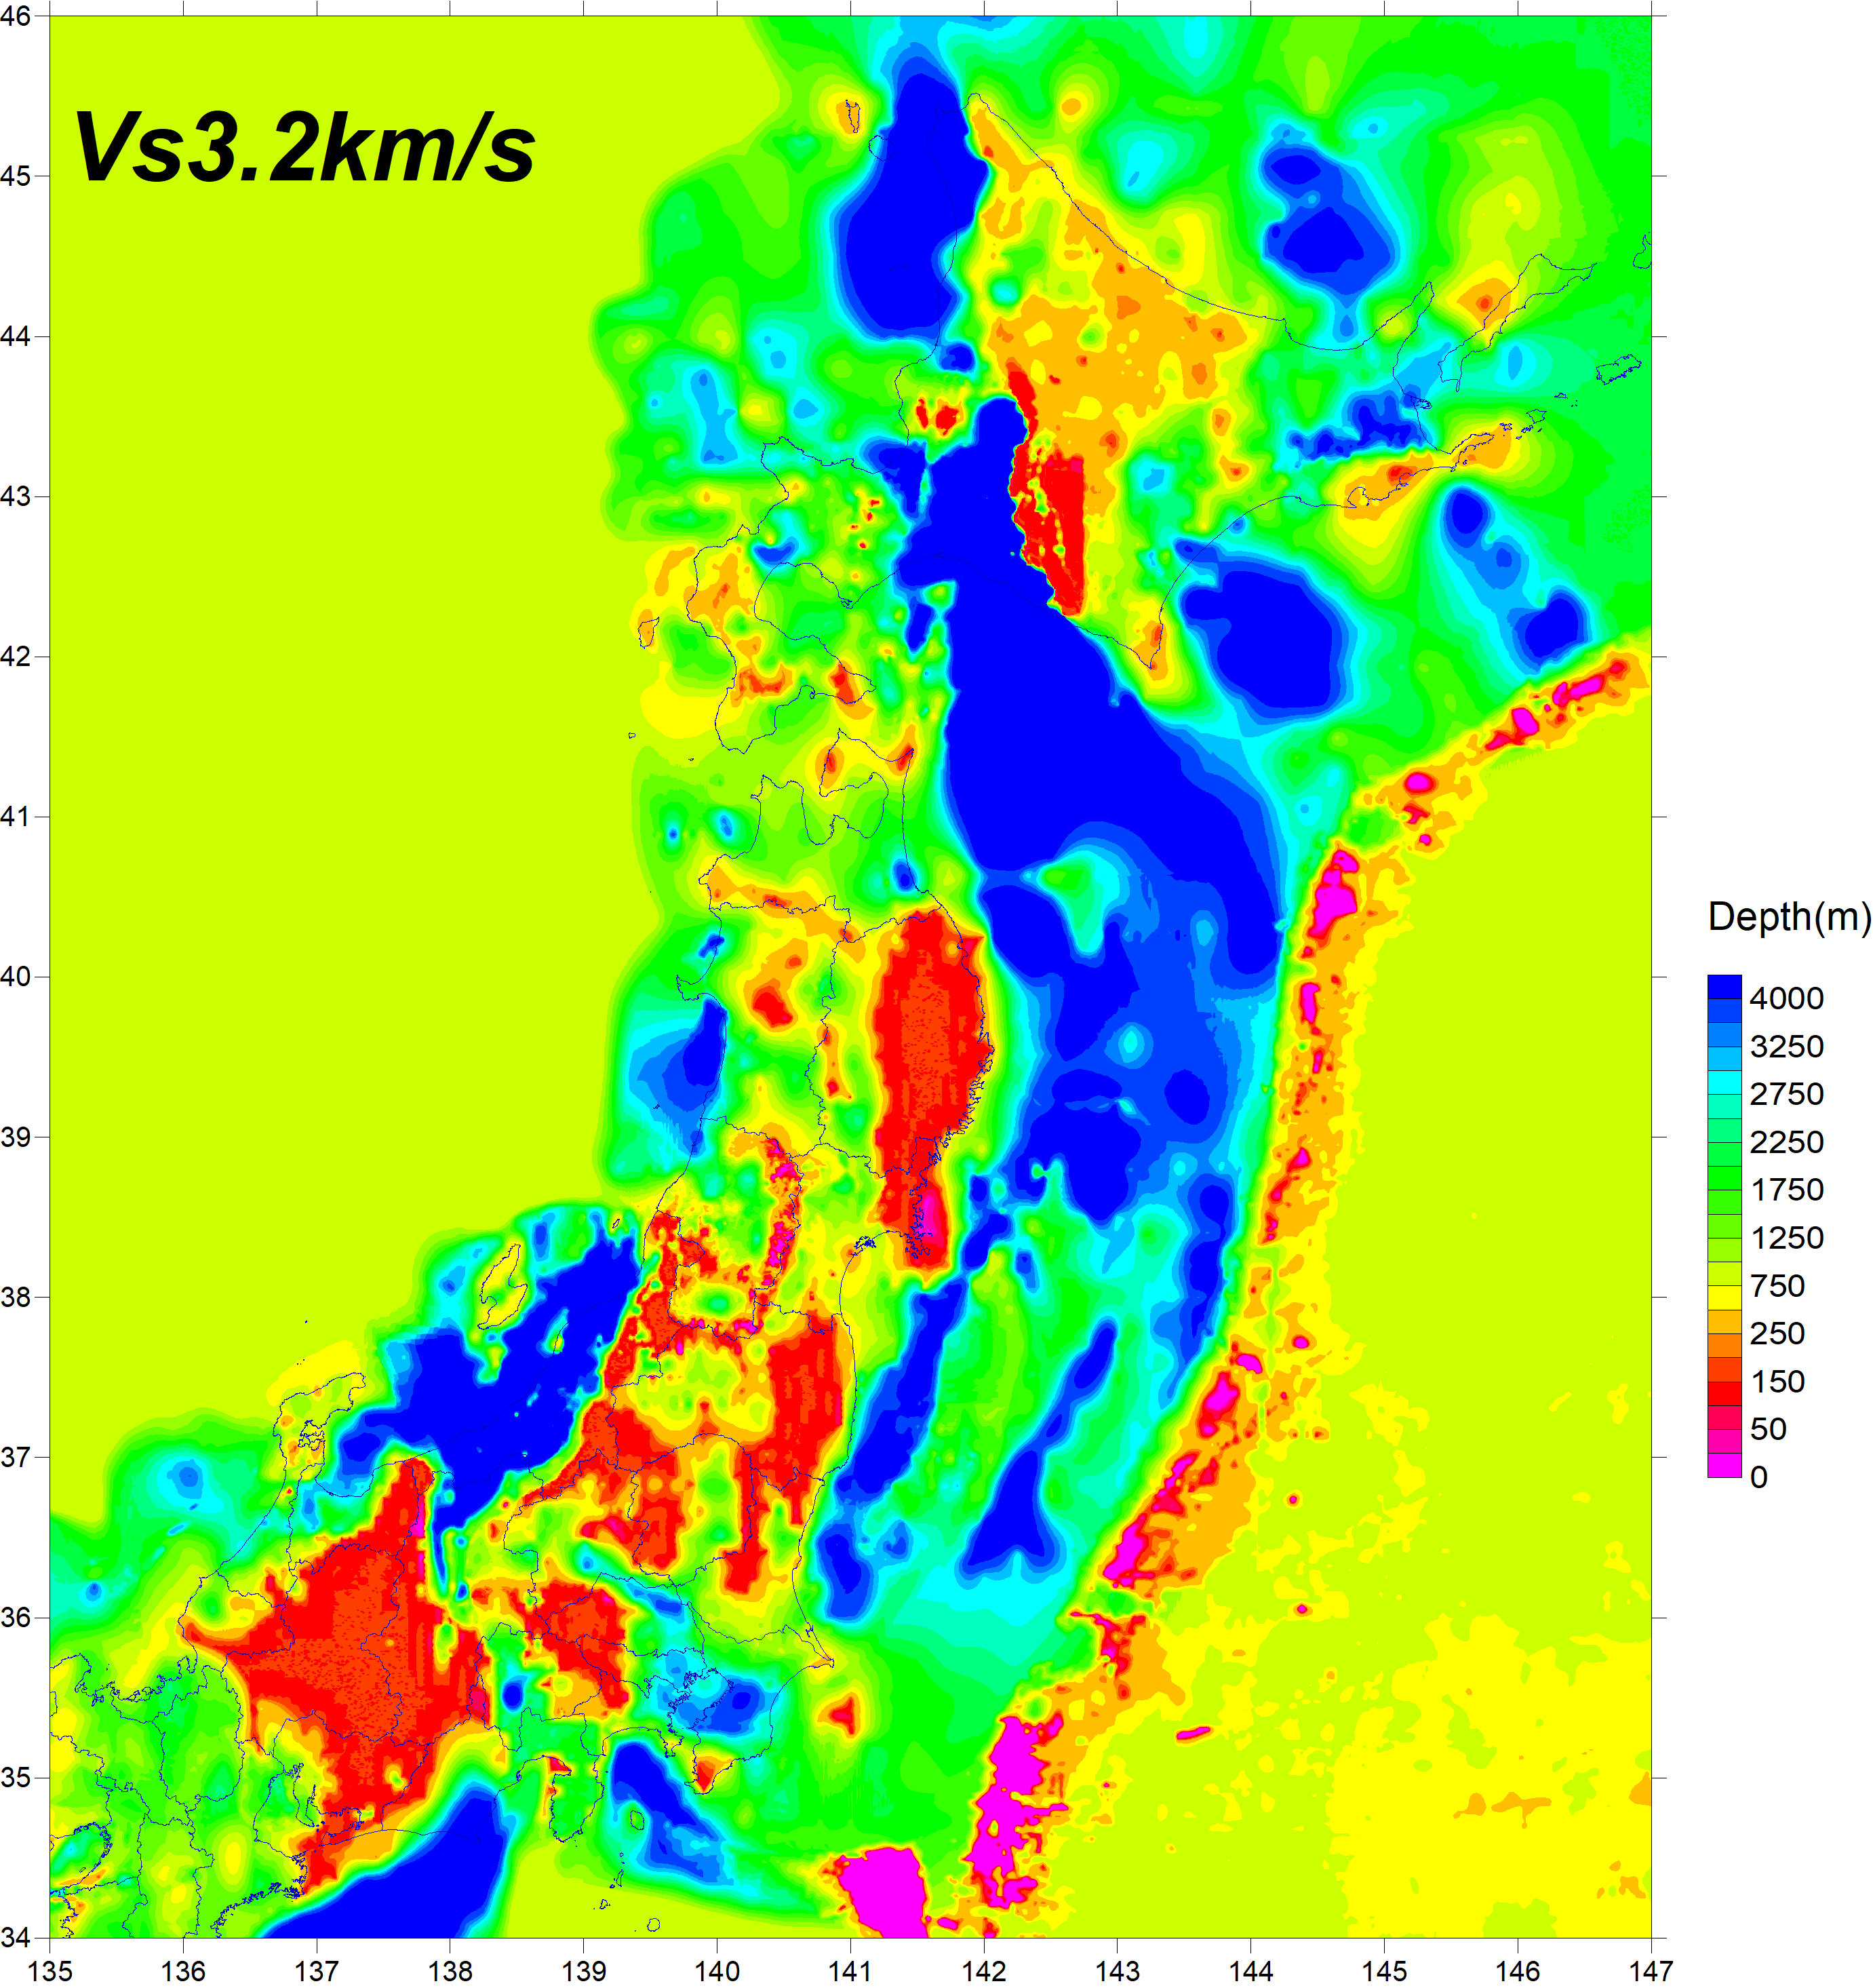
However, the old edition was made with the positional information in the Japanese geodetic system (“Tokyo Datum”), which was used by 2001, and is outdated. Therefore, a revised edition that has been recreated using the positional information in the global geodetic system (“Japanese Geodetic Datum 2000”) based on the International Terrestrial Reference Frame (ITRF), which has been adopted since 2002, is located in the second place below. The right panel of Fig. 6 shows the depth distribution of the upper boundary of the basement layer (VS 3.2 km/s) in the eastern half of the revised edition, superimposed on the map of Japan in the global geodetic system. Comparing this with the old edition and the map of Japan in the Japanese geodetic system in the left panel of Fig. 6, there is almost no difference, so it can be judged that the conversion of the geodetic system was performed correctly.
Multi-point Kriging interpolation was used for model construction and datum conversion. However, we have confirmed that the depth error is less than 1 m even with linear interpolation using four surrounding points, so linear interpolation can also be used when using the model.
|

|
|
|
|
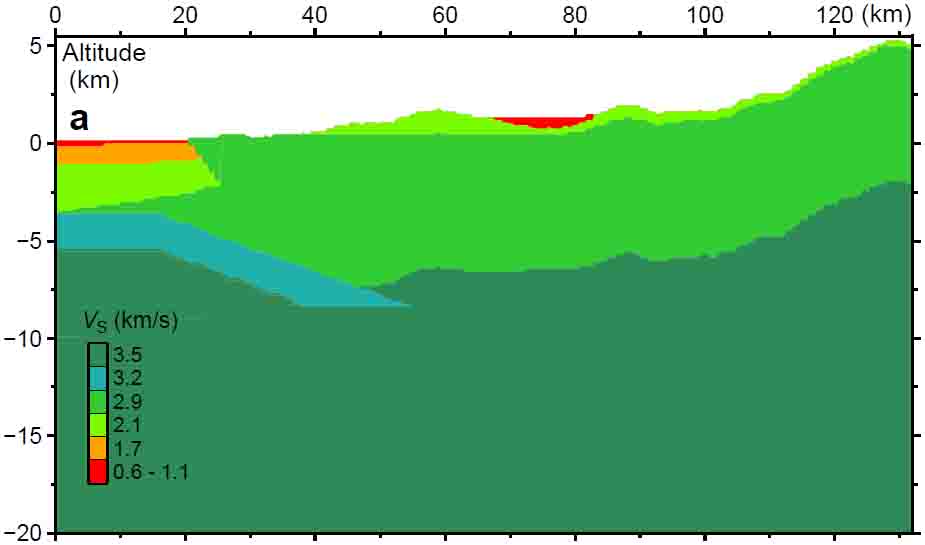
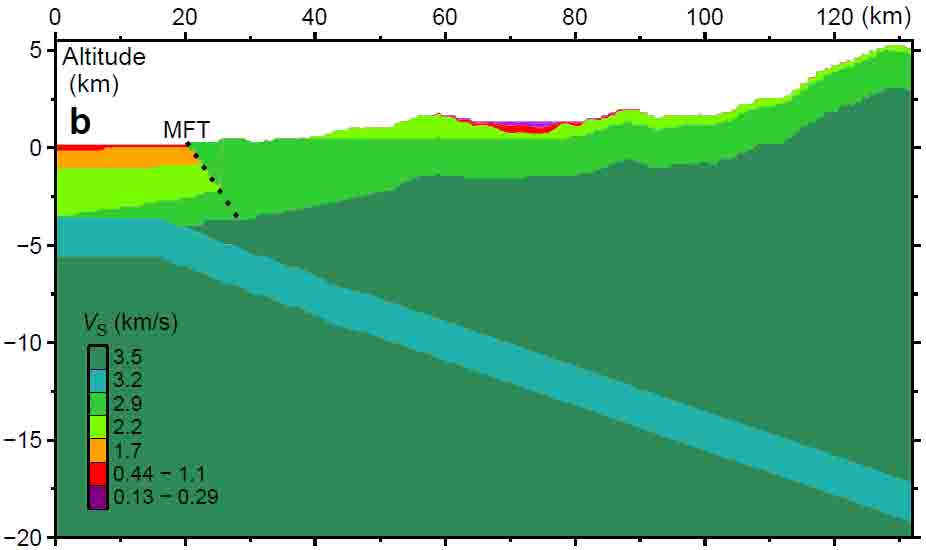
Nepal is an earthquake-prone country and its capital is located in the Kathmandu Valley. It is therefore important to accurately assess the seismic hazards there, and ground motion simulations based on accurate velocity structure models in and around the valley are essential for such assessments. The collision of the Indian plate with the Eurasian plate is causing the Himalayan orogeny, which has formed many valleys and basins. The largest among them is the Kathmandu Valley. This valley is filled with sediments from the Bagmati River and its tributaries. The Paleo-Kathmandu Lake was formed 1 million years ago by the damming of the Bagmati River, and dried 12,000 years ago (Sakai et al. 2016). This geological history has resulted in the velocity structure of the Kathmandu Valley being three-dimensionally complicated. The collision of the plates also causes the Indian lithosphere to underthrust beneath Nepal along the Main Himalayan Thrust, which reaches the ground surface at the Main Frontal Thrust (MFT in Fig. 7). This underthrusting generates earthquakes and three-dimensionally complicates the velocity structure around the Kathmandu Valley. Therefore, Koketsu et al. (2024) constructed the three-dimensional velocity structure models in and around the Kathmandu Valley using diverse datasets and information.
 |
 |
|
|
|